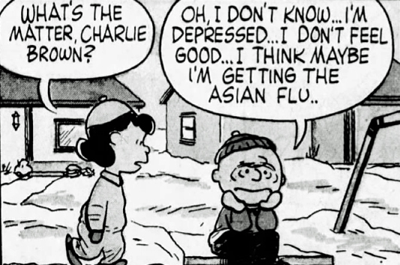
On March 9, 1958, a global flu pandemic unofficially became a national joke. When Americans turned to the funny pages of their Sunday morning newspapers, they found Charlie Brown, the sad sack hero of Minnesotan Charles Schulz’s “Peanuts” comic strip, lamenting his shortcomings on the hockey rink.
“I don’t feel good,” Charlie Brown told his nemesis, Lucy. “I think maybe I’m getting the Asian flu.”
Lucy, as usual, showed no sympathy. She informed her downcast companion that the “Asian flu” was yesterday’s news. “What a guy!” she exclaimed as she walked away. “Everyone else got the Asian flu six months ago, and he’s just getting it now!”
Charlie Brown was left to deliver the punch line to himself. “Good grief!” he sighed. “I can’t even get sick right!”
It was a funny joke — at the time.
A disconnect between perception and reality
But decades later, with the benefit of hindsight, it doesn’t seem quite so funny. That’s because we know something now that Schulz and his readers didn’t know back then. According to the Centers for Disease Control, the “Asian flu” pandemic of 1957 and 1958 killed an estimated 116,000 Americans and around 1.1 million people worldwide. It was one of the worst public health crises of the 20th century. So how did it become the butt of a joke in the Sunday morning comic section? The answer lies in what was, at the time, a widespread public misunderstanding about the scope of the pandemic — a disconnect between perception and reality. It was the kind of disconnect that we should keep in mind today, as we try, in real time, to make sense of the havoc the new coronavirus is causing.
In March 1958, when the “Peanuts” comic strip appeared, the “Asian flu” — an influenza caused by a new strain of the H2N2 virus — was a well-known fact of life in the United States. It had emerged about a year before in Singapore and Hong Kong, and had spread to U.S. coastal cities in the summer of 1957. Scientists determined early on that very few Americans were immune to the new virus, and they raised public alarms about its potential lethality. (They also rushed to create a vaccine that played a crucial role in limiting the virus’ spread.) When the “Asian flu” arrived in Minnesota in September 1957, people were ready for the worst.
But the “Asian flu” never seemed to live up to its advance billing. State and local health officials reported occasional outbreaks, including one that clobbered Minneapolis’ North High School in October, but the information they shared with the public inadvertently downplayed the virus’ severity. Laborious testing protocols made it difficult to confirm that a patient with flu-like symptoms had actually contracted the “Asian flu,” so mortality statistics released to the public included very few “Asian flu” deaths. At the end of 1957, when the pandemic’s first wave had subsided, Minneapolis’s health commissioner reported a total of just 18 confirmed deaths from the new H2N2 virus — a sobering number, certainly, but nothing close to the numbers that Minnesotans had been primed to expect. And the national death toll was similarly underwhelming: about 6,000 deaths attributed to the new H2N2 virus throughout the entire United States.
Determining ‘excess mortality’
So how do we explain the discrepancy between the 6,000 fatalities ascribed to the “Asian flu” at the time of the pandemic, and the 116,000 deaths that the CDC now estimates occurred then? It all comes down to how fatalities are tabulated and estimated. In an ongoing pandemic, death tolls are based on reports of fatalities officially attributed to the pathogen in question. But those real-time numbers almost always turn out to be undercounts. The true scope of a pandemic’s deadly toll becomes clear only after the fact, when experts use statistical modeling to determine “excess mortality” — the number of deaths beyond what would normally be expected. There’s nothing particularly controversial about using excess mortality to estimate the number of people killed in a pandemic. It’s generally considered the most accurate way to express results of what is admittedly an inexact science. And if you compare at-the-time death tolls of other pandemics with after-the-fact estimates based on excess mortality, you see discrepancies similar to the ones that showed up after the 1957-58 “Asian flu” pandemic.

[image_caption]Dave Kenney[/image_caption]
In July 2009, toward the end of the first wave of the H1N1 “swine flu” pandemic in the U.S., the government reported 302 deaths attributed to the virus. The CDC now estimates that more than 12,000 Americans died in that pandemic.
The lesson is simple: It’s nearly impossible to know how deadly a pandemic really is while you’re living through it.
If you find yourself wondering whether Minnesota’s relatively low number of confirmed COVID-19 fatalities (so far) suggests the coronavirus has been overhyped, remember the mistake Charlie Brown and Lucy made back in 1958. They dismissed the “Asian flu” as a nuisance to be laughed off, when it was actually killing more than 100,000 Americans. But Schulz didn’t know any better. Nobody did back then. The true scope of the 1957-58 pandemic became clear only with the passage of time and the application of statistical modeling. Now all of us find ourselves in a similar moment of muddled perceptions. Whatever the numbers tell us today about infections and fatalities, they almost certainly represent a significant undercount. It’s a sobering thought, but it’s also a reminder of why we continue to put up with this unprecedented disruption of our lives.
Dave Kenney is a freelance writer specializing in Minnesota history.
WANT TO ADD YOUR VOICE?
If you’re interested in joining the discussion, add your voice to the Comment section below — or consider writing a letter or a longer-form Community Voices commentary. (For more information about Community Voices, see our Submission Guidelines.)


It’s not just the 1950s flu that was “under-reported’ due to the difficulty in counting real-time outbreaks. The number of deaths from the Katrina hurricane and the more recent Puerto Rica hurricane were grossly under-counted until more than a year after those events. Current guess-timates put US Covid-19 deaths at tens of thousands more than the current 60,000-and-climbing. Assuming we return to something similar to normal 2-3 years from now, we’ll have better, more accurate numbers. When people are up to their necks in alligators, they generally don’t accurately count the alligators.
And then we have some politically conservative news outlets, like the local Star Tribune, that deliberately decide to publish only under-counts of the deaths from our current pandemic. (They refuse to count the many thousands of “untested” Covid-19 deaths in New York City, for example.)
That paper has opted to go only with test-confirmed Covid-19 death numbers, despite the gross under-testing nationwide, because it is upsetting to certain conservatives that there have been thousands of probably- Covid-19 deaths of people at home, corpses that are never autopsied to see whether they died of this virus.
That’s irresponsible journalism, in my book. The Strib and other media outlets could easily publish two numbers–the “official” count and the probable total. Explaining what each is. We don’t always have to be so far off the true numbers in pandemics.
This pandemic’s deniers and minimizers benefit from gross under-counting of the dead from the virus. There is, in our current crisis, an unreported political motive, from the Trump administration on down, to not having the public know how bad this is.
I just discovered with this article that I’m a survivor of a previous flu pandemic. Thanks to Mr. Kenney for some much needed perspective, clarity and sanity in this stressful time.
This article just gained a new level of relevance:
https://www.huffpost.com/entry/trump-cdc-covid-preexisting-conditions_n_5f4d9514c5b64f17e141b716