[raw shortcodes=1]
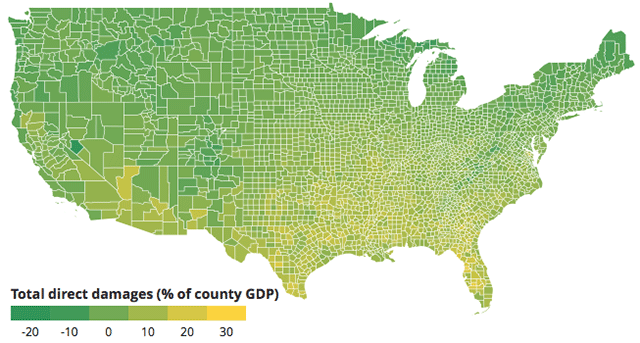
Scientists predict places like Texas and Florida will be bracing for more hurricanes like Harvey and Irma as the earth heats up in the coming years, and that rising temps and extreme weather events will cost those states’ economies.
Minnesota, not as much. According to a new study from an interdisciplinary team of researchers, Minnesota and other parts of the country, especially the upper Midwest, Northeast and West actually stand to benefit from climate change. At least in some ways.
The study, published in Science this summer, is the first to estimate the effects of climate change on multiple sectors at the county level, said Amir Jina, an assistant professor at the University of Chicago’s Harris School of Public Policy and a co-author of the report. The researchers assumed a “business as usual” scenario — what Jina described as “the world if we don’t adhere to the Paris Agreement, but don’t get too much worse in terms of what we’re doing” — and projected the effects of climate change out to around the end of the current century, 2080-99.
What they found surprised even them. While people often talk about how the world’s poorest countries will be disproportionately hurt by climate change, Jina and his colleagues found the same patterns across counties in the U.S., with the poorest third of counties, many of them in southern states, projected to experience much larger income losses by the end of the century than their wealthier counterparts, largely in the Northwest, upper Midwest and Northeast.
Don’t get too excited about a warmer Minnesota, though. Even though some of the states’ counties benefit from climate change in the study’s projections, climate change, on the whole, has some pretty bad implications.
[cms_ad:x104]
Agriculture
Contrary to what you might assume, a warming climate isn’t all bad for farmers. In some cases, a longer growing season could bring economic benefits to states, with better crop yields. But overall, higher temperatures, droughts, and more extreme weather events predicted to be brought on by climate change are a mixed bag for the U.S. as well as for Minnesota counties.
The states whose agricultural sectors are most adversely affected by climate change in the model tend to be those whose crops are already vulnerable to hot temperatures, like east and south Texas, Missouri, Tennessee, and a considerable share of the American South. (The study looked at corn, wheat, soybeans and cotton. Minnesota’s biggest crops are corn, soybeans, sugarbeets and wheat.)
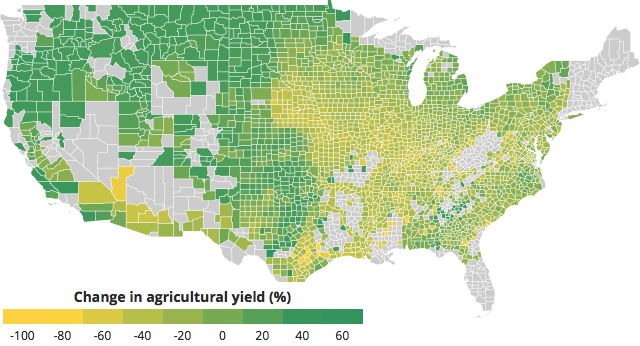
In general, the study projects that parts of the Great Plains, the Upper Midwest, the Pacific Northwest and the East, where winters today can be long and unforgiving, will see increased crop yield as a result of warming temperatures.
In parts of Northern Minnesota crop yield could increase by nearly 40 percent. But in Southern and Central Minnesota counties, average yield for crops could be 20 to 30 percent lower. The study accounts for expected change in rainfall, but not flooding in places like Minnesota that do not have coastal property, Jina said.
“Some farmers have the ability to irrigate when there’s a drought, but when you get these big storms, 10 to 15 inches of rain in one day, there’s nothing you can do about it and it can ruin your crops,” said Lee Frelich, the director of the University of Minnesota Center for Forest Ecology.
Mortality
If climate change out plays out as envisioned in the study, mortality rates in Minnesota will drop in every county in the state.
Of course, some causes of deaths are directly attributable to weather conditions: think deaths that result from hypothermia or heatstroke. But the study went deeper than that.
“The kinds of things we’re picking up on are actually much more subtle,” Jina said. “We can use some advanced statistical techniques to work out what the attributable portion of deaths (are) due to weather fluctuations or climate fluctuations.”
That might include, say, someone who has a heart condition, where being exposed to a cold snap might make their heart go into overdrive, hastening death, he said.
Under the study’s conditions, mortality rates are estimated to decline the most in northern Minnesota — by more than 30 deaths per 100,000 residents — and go down, albeit less, in the metro area and parts of southern Minnesota.
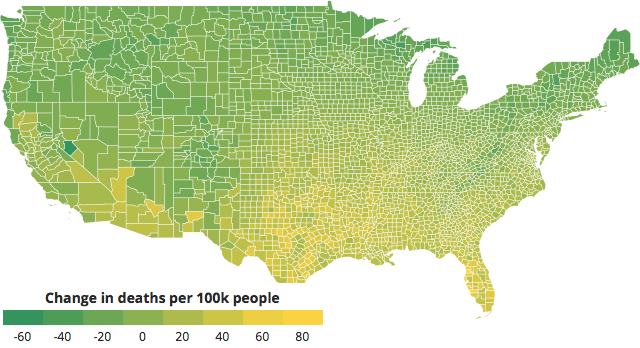
Warmer temperatures don’t always save lives, though. In some parts of Florida and Texas, for example, mortality rates could increase by as much as 60 to 70 per 100,000 residents due to warming.
Heat can kill in a variety of ways, direct and indirect. It, for example, contributed to more than 700 deaths in Chicago during a 1995 heat wave where daily temperature highs spiked to the high ‘90s and hundreds for the better part of a week. But flooding, wildfires and crop shortages caused by rising temps could also kill more people.
Energy expenditure and labor supply
If it gets hotter in Minnesota, people are likely to use more air conditioning, driving up energy costs, more in southern counties than in northern ones.
The increase in energy expenditures across counties ranges from about 2 percent, in some of the northernmost parts of Minnesota, in projections, to 8 percent or slightly more in the state’s more southerly reaches.
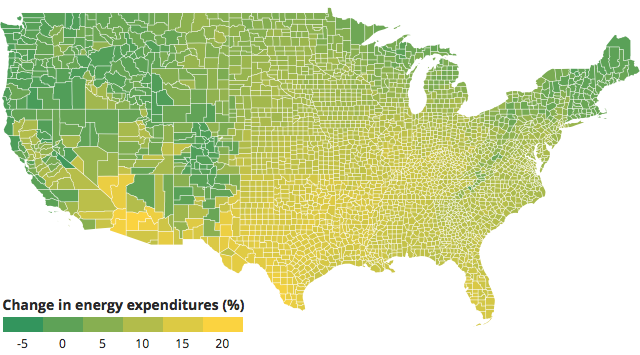
That’s less than half the 18 to 19 percent estimated increase in parts of Arizona (looking at you, Phoenix area), Hawaii and Texas.
When it’s hot out, working people sometimes lose steam, particularly at certain jobs that expose them to the elements. It’s also less safe for them to be laboring out-of-doors.
Parts of some Sunbelt states could lose as much of 3 percent of labor supply (roughly, the number of hours employees are willing to work) among workers exposed to the elements, which the study calls “high-risk” labor. In Minnesota counties, the decrease in high-risk labor supply is less than 1.5 percent.
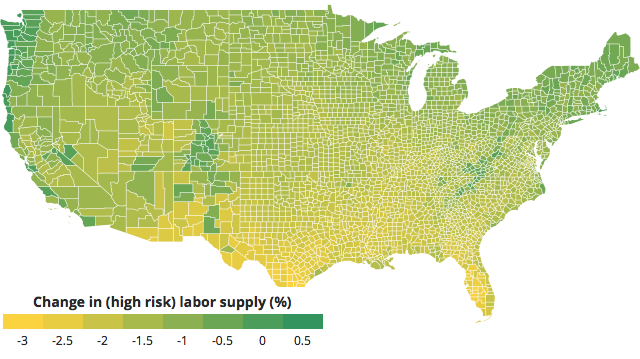
For low-risk labor, the kind generally protected by air conditioning, labor supply change doesn’t vary as much by county across the U.S.
Crime
Research has established a connection between higher temperatures and crime rates: on warmer days, people are more likely to rob a house or shoot someone.
That’s partly because nobody really wants to go outside for any reason when it’s freezing cold out. But more recent research on the physiological side has also connected higher temperatures to more aggressive behavior in humans, Jina said.
The study projects violent crime would increase by about 4 percent by the end of the century in Minnesota counties, while property crime would increase between 2 and 3 percent.
Along with parts of Alaska, Michigan and other states with real winters, Minnesota counties stand to see some of the biggest increases in this regard. That’s because, theoretically, there will be fewer cold days in these states with presently frigid temperatures for a lot of the year.
Minnesota of the future is Kansas
Based on these projections, Minnesota doesn’t look as bad as some states as far as effects of climate change by the end of the century go. But it also doesn’t really look like Minnesota.
The temperatures in Minnesota could increase by as much as 12 to 15 degrees by the end of the century, Frelich, of the University of Minnesota, said. An extra few degrees to take the edge off the winter might sound nice, but at 15 degrees warmer, Minnesota would look more like Kansas.
When you drive up I-35 north of the Twin Cities toward Duluth, there’s a point at which the suburbs evaporate. For a while, there are grasses and then, suddenly, the freeway is flanked by pine trees. Minnesota is split more or less down the middle into two types of environments: prairie and forest. But in a business as usual scenario, Frelich said, the forest line moves about 300 miles north, to about the latitude of Thunder Bay and the very northernmost reaches of Minnesota.
Some of the lakes in the middle part of the state, around the Brainerd area, many of which are shallow, could dry up and disappear, their water evaporating at higher overall temperatures.
Pretty much all the boreal forests, with pine, spruce, birch and fir, and other plants and animals, like moose, that live in them, would likely disappear. Already, warm weather trees, like maples, can be seen in northern Minnesota forests where they weren’t before, Frelich said.
Many insects, whose proliferation is limited because the warm season is so short here, would have booming populations, annoying people and killing trees. There could more droughts and more giant storms.
Shared costs
One reason so many southern locales are projected to be so hurt by climate change is because they’re near coasts. In addition to tropical storms and other extreme weather events, rising sea levels are projected as one effect of climate change. Some counties in Florida could lose up to 2 percent of their gross state product to coastal damage resulting from climate change.
Without any coastal exposure, Minnesota won’t suffer these costs. At least not directly. (Minnesota’s rivers and streams might overflow with heavy rainstorms, but inland flooding models aren’t yet good enough to include, Jina said.) But that doesn’t insulate Minnesotans from this cost of climate change.
Last week, President Donald Trump signed a $15 billion relief package to help with Hurricane Harvey relief efforts on Texas’ gulf coast and the surrounding area.
If more storms like Harvey and Irma occur, taxpayers from around the country will be footing the bill for recovery.
“There’s problems that are so large that it makes sense to be solved at a federal level … this turns into something which doesn’t just affect those places that get hit, but affect everybody,” Jina said.
It’s also important to remember that the study is a projection. It included the variables that researchers thought were the most important, given the data available. It didn’t include things like loss of species diversity for which there wasn’t enough research to include. The projections should be considered as lower bounds on damages.
Then, of course, there are other caveats. Habits will change, and people will likely move, if temperatures warm. Because of those things, the model was designed to be updated as additional data becomes available.
The point, Jina said, is to provide policymakers and investors with the best information they can get for now, so they can make decisions about how to move forward.
window.mobilecheck = function() {
var check = false;
(function(a){if(/(android|bbd+|meego).+mobile|avantgo|bada/|blackberry|blazer|compal|elaine|fennec|hiptop|iemobile|ip(hone|od)|iris|kindle|lge |maemo|midp|mmp|mobile.+firefox|netfront|opera m(ob|in)i|palm( os)?|phone|p(ixi|re)/|plucker|pocket|psp|series(4|6)0|symbian|treo|up.(browser|link)|vodafone|wap|windows ce|xda|xiino/i.test(a)||/1207|6310|6590|3gso|4thp|50[1-6]i|770s|802s|a wa|abac|ac(er|oo|s-)|ai(ko|rn)|al(av|ca|co)|amoi|an(ex|ny|yw)|aptu|ar(ch|go)|as(te|us)|attw|au(di|-m|r |s )|avan|be(ck|ll|nq)|bi(lb|rd)|bl(ac|az)|br(e|v)w|bumb|bw-(n|u)|c55/|capi|ccwa|cdm-|cell|chtm|cldc|cmd-|co(mp|nd)|craw|da(it|ll|ng)|dbte|dc-s|devi|dica|dmob|do(c|p)o|ds(12|-d)|el(49|ai)|em(l2|ul)|er(ic|k0)|esl8|ez([4-7]0|os|wa|ze)|fetc|fly(-|_)|g1 u|g560|gene|gf-5|g-mo|go(.w|od)|gr(ad|un)|haie|hcit|hd-(m|p|t)|hei-|hi(pt|ta)|hp( i|ip)|hs-c|ht(c(-| |_|a|g|p|s|t)|tp)|hu(aw|tc)|i-(20|go|ma)|i230|iac( |-|/)|ibro|idea|ig01|ikom|im1k|inno|ipaq|iris|ja(t|v)a|jbro|jemu|jigs|kddi|keji|kgt( |/)|klon|kpt |kwc-|kyo(c|k)|le(no|xi)|lg( g|/(k|l|u)|50|54|-[a-w])|libw|lynx|m1-w|m3ga|m50/|ma(te|ui|xo)|mc(01|21|ca)|m-cr|me(rc|ri)|mi(o8|oa|ts)|mmef|mo(01|02|bi|de|do|t(-| |o|v)|zz)|mt(50|p1|v )|mwbp|mywa|n10[0-2]|n20[2-3]|n30(0|2)|n50(0|2|5)|n7(0(0|1)|10)|ne((c|m)-|on|tf|wf|wg|wt)|nok(6|i)|nzph|o2im|op(ti|wv)|oran|owg1|p800|pan(a|d|t)|pdxg|pg(13|-([1-8]|c))|phil|pire|pl(ay|uc)|pn-2|po(ck|rt|se)|prox|psio|pt-g|qa-a|qc(07|12|21|32|60|-[2-7]|i-)|qtek|r380|r600|raks|rim9|ro(ve|zo)|s55/|sa(ge|ma|mm|ms|ny|va)|sc(01|h-|oo|p-)|sdk/|se(c(-|0|1)|47|mc|nd|ri)|sgh-|shar|sie(-|m)|sk-0|sl(45|id)|sm(al|ar|b3|it|t5)|so(ft|ny)|sp(01|h-|v-|v )|sy(01|mb)|t2(18|50)|t6(00|10|18)|ta(gt|lk)|tcl-|tdg-|tel(i|m)|tim-|t-mo|to(pl|sh)|ts(70|m-|m3|m5)|tx-9|up(.b|g1|si)|utst|v400|v750|veri|vi(rg|te)|vk(40|5[0-3]|-v)|vm40|voda|vulc|vx(52|53|60|61|70|80|81|83|85|98)|w3c(-| )|webc|whit|wi(g |nc|nw)|wmlb|wonu|x700|yas-|your|zeto|zte-/i.test(a.substr(0,4))) check = true;})(navigator.userAgent||navigator.vendor||window.opera);
return check;
$.getJSON(“https://s3.amazonaws.com/data.minnpost/projects/minnpost-climate-change-county/county_climate_effects.json”, function(data) {
if (!mobilecheck()) {
$(‘#map-total’).vectorMap({
map: ‘contiguous-us-counties_mill_en’,
backgroundColor: ‘#ffffff’,
zoomOnScroll: false,
regionStyle: {
initial: {
fill: “#cccccc”,
stroke: “none”
}
},
series: {
regions: [{
values: data.total,
scale: [‘#32955d’, ‘#fbd341’],
normalizeFunction: ‘linear’,
legend: {
title: “Total direct damages (% of county GDP)”,
vertical: false
},
}]
},
onRegionTipShow: function(e, el, code){
el.html(el.html() + “: ” + data.total[code] + “%”);
}
});
$(‘#map-crop’).vectorMap({
map: ‘contiguous-us-counties_mill_en’,
backgroundColor: ‘#ffffff’,
zoomOnScroll: false,
regionStyle: {
initial: {
“stroke-width”: 0,
fill: “#cccccc”
}
},
series: {
regions: [{
values: data.crop,
scale: [‘#fbd341’, ‘#32955d’],
normalizeFunction: ‘linear’,
legend: {
title: “Change in agricultural yield (%)”,
vertical: false
},
}]
},
onRegionTipShow: function(e, el, code){
el.html(el.html() + “: ” + data.crop[code] + “%”);
}
});
$(‘#map-mortality’).vectorMap({
map: ‘contiguous-us-counties_mill_en’,
backgroundColor: ‘#ffffff’,
zoomOnScroll: false,
regionStyle: {
initial: {
“stroke-width”: 0,
fill: “#cccccc”
}
},
series: {
regions: [{
values: data.mortality,
scale: [‘#32955d’, ‘#fbd341’],
normalizeFunction: ‘linear’,
legend: {
title: “Change in deaths per 100k people”,
vertical: false
},
}]
},
onRegionTipShow: function(e, el, code){
el.html(el.html() + “: ” + data.mortality[code] + ” deaths per 100k people”);
}
});
$(‘#map-energy’).vectorMap({
map: ‘contiguous-us-counties_mill_en’,
backgroundColor: ‘#ffffff’,
zoomOnScroll: false,
regionStyle: {
initial: {
“stroke-width”: 0,
fill: “#cccccc”
}
},
series: {
regions: [{
values: data.energy,
scale: [‘#32955d’, ‘#fbd341’],
normalizeFunction: ‘linear’,
legend: {
title: “Change in energy expenditures (%)”,
vertical: false
},
}]
},
onRegionTipShow: function(e, el, code){
el.html(el.html() + “: ” + data.energy[code] + “%”);
}
});
$(‘#map-labor’).vectorMap({
map: ‘contiguous-us-counties_mill_en’,
backgroundColor: ‘#ffffff’,
zoomOnScroll: false,
regionStyle: {
initial: {
“stroke-width”: 0,
fill: “#cccccc”
}
},
series: {
regions: [{
values: data.labor,
scale: [‘#fbd341’, ‘#32955d’],
normalizeFunction: ‘linear’,
legend: {
title: “Change in (high risk) labor supply (%)”,
vertical: false
},
}]
},
onRegionTipShow: function(e, el, code){
el.html(el.html() + “: ” + data.labor[code] + “%”);
}
});
$(‘.jqvmap img’).remove();
}
});
}(jQuery));[/raw]

