[raw shortcodes=1]
Last week, Mayor Jacob Frey announced a goal to fund $50 million on housing projects in Minneapolis as part of efforts to address an affordable housing crisis in a city “growing faster than it has since 1950.”
Look no further than trying to rent an apartment or buy a house these days to see that yes, the city’s burgeoning population is putting a crunch on some of its resources. But that fast?
Yep. And then some.
Between 1940 and 1950, Minneapolis added more than 29,000 people, an increase of 6 percent, according to U.S. Census data. By 2020, the Metropolitan Council projects that Minneapolis will have added about 40,000 residents since 2010, an increase of more than 10 percent.
For the last 70 years, though, growth has been the exception rather than the rule for Minneapolis’ population. Here’s a look at the bumps and dips in the city’s population history.
Boom and decline
Minneapolis first incorporated as a city in 1867, but it didn’t show up on the Census Bureau’s list of urban places until 1880.
That year, the city listed a population of 46,887, making it the U.S.’ 38th largest city.
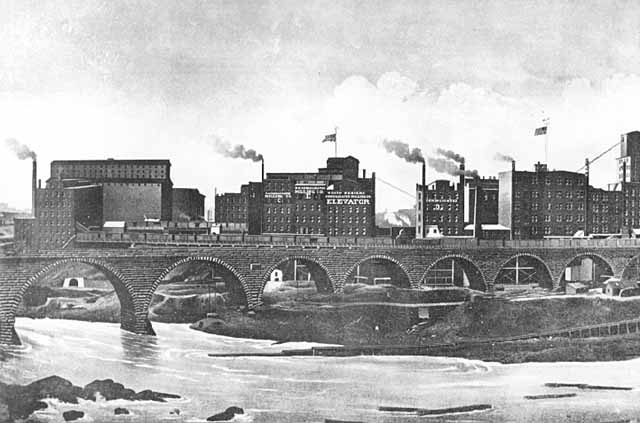
In the decades that followed, three major industries — warehousing, lumber and flour milling — would create demands for workers that fueled a population boom.
Minneapolis’ central location made it a natural place for warehousing. In fact, if you walked through the North Loop’s trendy converted warehouse apartments a century ago, you’d find them full of farm implements and other goods waiting to be shipped on trains across the plains.
“We’re right in the middle, and we had a great train system. Order your plow and it’ll arrive in the next week or two on the train, or any of your other supplies,” said Penny Petersen, an author of local history books who also works with Mapping Prejudice, a history project looking at racial disparities in housing.
Head toward the river and you’d find lumber mills, and, of course, flour mills. For a time, Minneapolis, which had the waterpower to run mills near St. Anthony Falls, was known as the flour milling capital of the world.
After booming from its earliest days to around 1920, population growth in Minneapolis slowed. One factor was immigration: In 1924, immigration quotas were imposed and immigrants from Asia were restricted outright.
But it also had to do with the economy. Minneapolis lost its status as the preeminent U.S. flour milling town after changes to trade law made it cost-effective to import Canadian wheat. While Minneapolis mills experimented with importing Canadian wheat to a degree, Buffalo, New York, near the Canadian border, rose to prominence in the milling industry.
“The economy in Minneapolis was pretty much exploding, especially from the 1870s through World War I, and then starting (during) World War I, things really started to decline,” said Kirsten Delegard, a scholar-in-residence at Augsburg who runs Historyapolis. “You have this economic decline in the ’20s and ’30s when a lot of other cities are expanding.”
But, in the 1920s, during a farm slump and through the Great Depression, enough people moved off the farms where they couldn’t make money and into the city for work to sustain slower growth.
Loss to the suburbs
In the 1940s, the economy of the Twin Cities grew stronger, as it shifted to more of an added-value economy, Delegard said: think General Mills focusing on breakfast cereal instead of flour, marketing and packaged foods. Its population continued to rise through the World War II years.
But after 1950, Minneapolis, like other cities, started to see the beginning of a decades-long decline in population.
Between low-cost mortgages, which made home ownership manageable for many families, and new highways, many families — particularly white, middle-class ones — moved from Minneapolis into the suburbs.
“A lot of the first-ring suburbs, like Hopkins, Richfield, Bloomington, and even St. Anthony — they were all farm communities up to that point. And then in the 1950s, these towns really took off population-wise,” said Heidi Heller, an archivist at the Hennepin History Museum.
Even some companies, like General Mills in 1958, moved to the suburbs.
The population loss only accelerated in the 1960s and ’70s. From 1970 to 1976, the Minneapolis Star reported, Minneapolis lost nearly 17 residents per day. At the time, the outflow of population was chalked up to the allure of the suburban lifestyle, as compared to the urban core.
“The city’s population loss has been attributed to several factors by planners, including the belief by many city dwellers that suburbs offer less crime, better schools, more housing choices and lower property taxes,” the Star reported.
Because of racial covenants, moving to the suburbs was an option available mostly to white families, which only served to exacerbate regional racial and socioeconomic segregation.
Minneapolis wasn’t the only city to see this pattern: These broad factors prompted rapid suburbanization, and consequent urban population loss, all over the country.
After decades of hemorrhaging population to the suburbs, Minneapolis’ population loss finally began to slow by the 1980s: For the first time since the 1940s, the number of births in the city of Minneapolis exceeded the number of deaths within city limits for three consecutive years, a 1981 article in the Star said.
Turnaround
In the 1990s, Minneapolis’ population hit a low, at 368,383 — a size not seen since before the 1920s. But economic prosperity in the ’90s helps explain why the population’s nosedive ended, said Matt Schroeder, a senior researcher at the Met Council: between 1990 and 2000, the city’s population grew by nearly 4 percent, according to the Census.
As the suburbs grew rapidly in the 2000s, enough people were moving in and out of the city that its population was essentially static, Schroeder said.
Between 2010 and 2016, Census figures put Minneapolis’ population growth at 8 percent.
Growth in the region has been fairly evenly distributed between the urban core and the suburbs, he said.
The population growth Minneapolis has seen in recent years isn’t unique to Minneapolis. In the years since 2010, many cities have seen rapid growth as young people move back into cities to be close to their jobs and other amenities.
Don’t get too excited, though: Minneapolis’ 8 percent growth between 2010 and 2016 is dwarfed by growth in Austin, Texas (20 percent); Seattle (16 percent); and Denver (15 percent), and is behind Portland’s (10 percent).
But the Mill City has grown faster than most other Midwestern cities, data show. Only Omaha, Columbus, Lincoln and Madison grew faster than Minneapolis between 2010 and 2016, according to Census data, while St. Louis, Cleveland, Toledo and Detroit lost population during that time period. St. Paul grew by 6 percent.
Vacancy rates have declined and there’s been a small increase in average household size this decade, too, indicating high demand and more people per unit in the city, Schroeder said.
Demand for housing in Minneapolis has spurred residential development in areas that weren’t highly populated — like downtown and the Warehouse District — but it’s also prompted new construction in some of the city’s established neighborhoods, with high-rise apartment towers going into neighborhoods like Uptown and Northeast Minneapolis.
“What has made such a difference this decade, I would say, is just that rapid growth in housing developments,” Schroeder said.
Correction: This article previously stated that Buffalo, New York’s proximity to the St. Lawrence Seaway helped its flour industry surpass Minneapolis’ in prominence. The St. Lawrence Seaway opened in 1959, after Buffalo ramped up its flour production.
MP.highcharts.makeChart(‘.chart-minnpop’, $.extend(true, {}, MP.highcharts.columnOptions,{ legend: { enabled: false }, xAxis: { categories: [‘1880′ ,’1890′ ,’1900’, ‘1910’, ‘1920’, ‘1930’, ‘1940’, ‘1950’, ‘1960’, ‘1970’, ‘1980’, ‘1990’, ‘2000’, ‘2010’, ‘2016’, ‘2020 (projected)’]
}, yAxis: { title: { text: ‘Population’}, }, tooltip: { formatter: function(){ return ‘ ‘ + this.x + ‘‘ + ‘: ‘ + MP.formatters.number(this.y,0) + ‘ people’; } }, series: [ { name: ‘Population’, data: [46887, 164738, 202718, 301408, 380582, 464356, 492370, 521718, 482872, 434400, 370951, 368383, 382618, 383280, 413645, 423300] }
]
})); }(jQuery));[/raw]


When we’re talking about history
When we’re talking about the history of white flight, it would be nice to explicitly note that the depopulation of Minneapolis from moves to the suburbs was heavily subsidized.
It was directly subsidized by federal mortgage programs that made buying a suburban home financially attractive (for the white people who qualified).
But it was also directly subsidized – no the backs of those who remained in the city – by the freeways and other major roads we built, using public money and urban space, in the attempt to offer those who fled easy trips back to the city for work, shopping and entertainment. We tore up whole communities for those freeways, of little use to people who live in the city. Worse, the traffic on them also pollutes adjacent communities.
Whatever people’s preferences were, the fact remains that white people moved to the suburbs because we set up financial and other incentives to encourage it.
Ike
Eisenhower was aghast to learn that the interstates would not terminate when they reached the cities, but would blow right through them. That was not his intention at all.
There was also the now-illegal practice of blockbusting
Real estate agents would go door-to-door through Minneapolis neighborhoods that were near African-American neighborhoods and tell homeowners, “This neighborhood is ‘going colored.’ You’d better sell before your property values decline too far. And by the way, we have this lovely little subdivision out in suburbs that you might like.”
White buyers who inquired about the neighborhood were told, “You don’t want to buy there. Colored are moving in.”
Black buyers were told that it was a lovely neighborhood with a lot of houses for sale cheap.
The objective, sadly quite successful most of the time, was to flip the houses from panicky white owners to upwardly mobile black buyers, while also creating a market for their new suburban neighborhoods.
Deep-seated (and probably unconscious) racism blinded many white owners to two facts: 1) Panic selling always lowers property values, and 2) The neighborhood couldn’t ‘go colored’ if most of the white people stayed.
The real estate agents created an extremely profitable scheme by creating a self-fulfilling prophecy.
Not everyone was sucked in. There was an attempt to blockbust Kenwood in the early 1960s, and I recall seeing signs on lawns to the effect that the homeowner had no intention of selling.
But an awful lot of white homeowners fell for the trick.
A further factor in white flight was the ham-fisted attempt to desegregate the schools in the 1970s, which briefly required schools to have certain exact percentages of black, white, and Native American students and required the redrawing of attendance boundaries if the racial composition of the school changed too much.
As one who spent most of elementary school in integrated classes in Wisconsin, I never understood the fear of having one’s child sit next to a black student, but I could see why the requirements for exact percentages drove people away.
I have long thought that most observers underestimate racism as a motivation for moving to the suburbs. After all, you can have a yard and trees and a garage in most of Minneapolis and St. Paul, just as you can in the suburbs.
Thanks, Greta, for providing this good historical recap of our city’s population trends and some reasons for the changes we’ve seen.
Wierd
Because if you listen to some people, the minimum wage and the sick leave, and the bike lanes and all the other new stuff Minneapolis is doing is driving people away. Not so much, it seems.
The Decline of Flour Milling
In 1930 Buffalo, N.Y., surpassed Minneapolis as the flour-milling capital of the nation. However, Buffalo’s rise to dominance cannot be attributed to proximity to the St. Lawrence Seaway, which didn’t open until 1959.
You would be correct. Thanks for pointing this out, Bruce. The article has been updated to reflect that fact.
great article
really sums up city trends in once neat narrative.
A thought on how we compare municipal growth rates
It seems there are two common ways we compare urban population growth, both of which seem flawed metrics in my opinion.
The first, by raw number of new residents, is highly variable based on the geographic area covered by a city. Minneapolis and St. Paul are among the smallest “big cities” in the US by geographic area. You have to combine both cities to get close to a geographic peer like Denver, Seattle, or Portland. So Minneapolis (or St. Paul) are always going to lag behind the raw growth numbers of our peer cities.
The second, growth as a percentage of existing population (e.g. 2010-2016 growth divided by 2010 census) is likely to favor those with smaller base populations (smaller denominator), so growth in Mpls or StP can’t match the growth *rate* of Blaine or Woodbury or whatever suburb, even though the central cities add far more in raw population counts.
A suggestion (and this is to be applied nationwide, not specific to this article or the Twin Cities):
When calculating urban population growth, why not express it as growth per square mile? Take the numeric growth (per year or per decade) and divide by the square mileage of whichever jurisdiction you’re looking at. That would do away with the geographic disparity/skew issues of comparing Minneapolis (58 sq mi) with Portland (145 sq mi). There could certainly be flaws in that method too, so poke away!
Greta,Here are a few things
Greta,
Here are a few things to think about.
1. Suburban migration post WWII was the most successful housing affordability program ever. If not for the creation of suburban housing, many Minneapolis families would have found themselves unable to afford to live in the city of Minneapolis.
2. If “whites” had not migrated to the suburbs, minorities would have been priced out of Minneapolis which would only serve “to exacerbate regional and socioeconomic segregation”.
3. The loss in population was exclusively a factor of the change in household size! Minneapolis’ household profile skewed older with less or no children in the years after WWII. Hence, less population however, just as many households.
I think you would be hard pressed to come up with a scenario where the population of Minneapolis did not decline.
Racial covenants
While racism drove much of the white flight to the suburbs, and there were many policies and practices that made it hard for minorities to move to many areas, I think it is not correct to say, “Because of racial covenants, moving to the suburbs was an option available mostly to white families…” Racially restrictive covenants were ruled unconstitutional and unenforceable in the late 1940’s, before the population decline started.